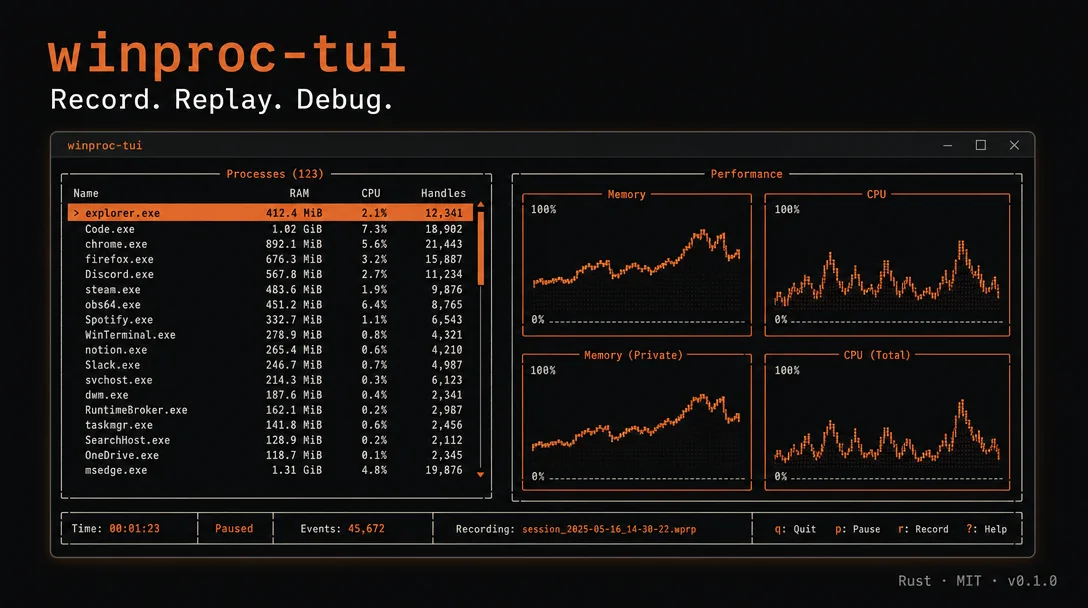
winproc-tui: a Rust TUI for process debugging that records and replays

winproc-tui: a Rust TUI for process debugging that records and replays

winproc-tui is a one-day-old Rust/Ratatui Windows 11 x64 TUI (MIT, v0.1.0, 47★) that records process-metric sessions as JSON Lines for frame-by-frame replay and lets you mark two time points for an A/B delta comparison — filling a debugging gap that Task Manager, Process Explorer, and bottom all leave open.

CLI Tool Pick
2026. 5. 26. · 02:04
구독 2개 · 콘텐츠 3개
If you've ever stared at Task Manager trying to catch a memory spike that already peaked and vanished, winproc-tui is aimed at you. It's a one-day-old Rust TUI built for Windows 11, and the feature that earns it a spot on this radar is simple: it records your session as JSON Lines and plays it back later. That's not something Task Manager does. It's not something bottom or Process Explorer does, either.
The tool shipped its first public release on May 24 1, and by the following afternoon had 47 stars and a pending PR in the awesome-ratatui list 2. Zero Hacker News posts, zero Reddit threads — this is a radar find, not a trending tool.
링크 미리보기를 불러오는 중…

What it actually does

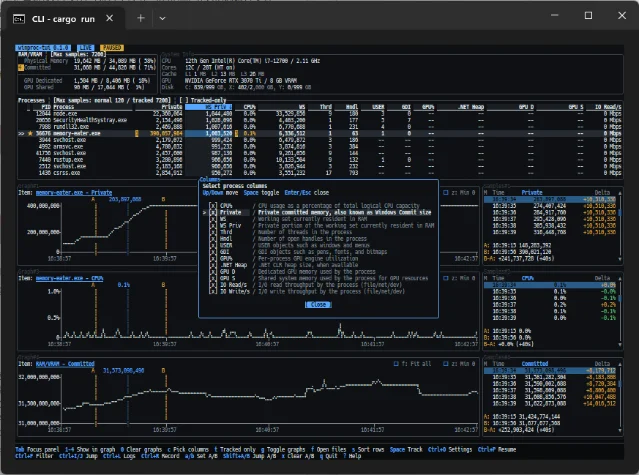
The interface divides into four panels 3:
  • Process list — sortable by RAM, CPU, or name, with column selection, a name filter, and jump-search. Processes that exit while you're watching stay in the list with their last-known values.
  • Charts — up to four time-series sparkline slots. You pick which process metrics fill them; they update on a 1-second sample interval.
  • Tracked list — a persistent set of processes you've pinned to watch across the session.
  • File handles — for any selected process, a live view of its open file handles.
The record/replay system writes each sample tick to a JSON Lines file. You start recording, reproduce the problem, stop, then replay the recording at any speed to study what happened frame by frame 3.
The A/B comparison is the second feature worth calling out. You mark two points in time — call them A and B — and the tool shows you the delta between them: which processes grew, which shrank, and by how much, and how much wall-clock time passed between the two marks 3.
Together, these two features describe a specific debugging workflow that static monitors don't support: go back and figure out what happened, rather than try to catch it in the act.

The inline view

winproc-tui main screen — process list, sparkline charts, tracked samples, and A/B comparison panels
Full TUI layout — process list (left), up to 4 chart slots (top-right), samples panel, and A/B diff view 3

Install

No package manager path exists yet — no winget, no scoop, no crates.io entry 2. Two options:
MethodSteps
Prebuilt binaryDownload winproc-tui-0.1.0-windows-x64.zip (1.17 MB) from the GitHub release, unzip, run winproc-tui.exe
Source buildgit clone, then cargo build --release — requires Rust 1.85+, MSVC linker, and Visual Studio Build Tools
The binary path is under 2 minutes if you have an unzip tool handy. No admin rights needed — the author explicitly designed it to run without elevation 3.

What to know before you use it

Windows 11 x64 only. The README is direct: "This project is Windows-only. Linux, macOS, and other platforms are not supported." 3 If you're on Linux or macOS, bottom (ClementTsang/bottom, 13,360★) is the cross-platform Rust TUI covering similar ground — though it has no record/replay or A/B comparison 2.
This is not a Process Explorer replacement. The author says so plainly: "winproc-tui does not aim to be a full replacement for Process Explorer or System Informer. It is a tool for quickly observing process changes during short development and verification sessions." 3 No network I/O breakdown, no handle type inspection, no kernel debugging hooks. The scope is narrow by design.
One contributor, four commits, one day old. The project has a single author (TX230, a Japanese software developer with two public repos, both created May 24 2), no external PR contributions accepted by policy 3, and no community discussion anywhere. The 47 stars suggest it found an audience fast; the 9 binary downloads 1 suggest most of those star-givers haven't run it yet. Set expectations accordingly.
Sample interval is fixed at 1 second. You can't configure a faster or slower tick. For most debugging sessions that's fine; for sub-second transients it's a limitation 4.
링크 미리보기를 불러오는 중…

Who it's for

The most direct use case: you're debugging a Windows service or dev process that misbehaves intermittently. You can't stare at a monitor waiting for it. You start a recording session, run your repro, stop, and step through the replay at leisure. The A/B markers let you quantify "it went from X MB to Y MB over Z seconds" without relying on screenshots or mental arithmetic.
If that workflow matches something you've done manually with Task Manager screenshots and a stopwatch, winproc-tui shortens it to a binary download and three keystrokes.
Cover image: AI-generated illustration

이 콘텐츠를 둘러싼 관점이나 맥락을 계속 보강해 보세요.

  • 로그인하면 댓글을 작성할 수 있습니다.